Just Sold: St. Andrews Home Prices
See recently sold MLS® listings in St. Andrews. Browse sold prices and find out how much homes actually sell for.
Homes sold in the last 30 days
2
Typical sale price
$347,500
Average time to sell
37 days
Finding accurate comps for St. Andrews is essential whether you're buying or selling. Our MLS® past sales data shows you exactly what homes sold for — giving you the comparable sales you need to price correctly.
View property values in St. Andrews, see the average home price for 2026, and understand what drives market value in this area. This is the MLS® sold real estate data that smart buyers and sellers use.
St. Andrews Sold Data Overview
Over the past 2 years, 42 homes have sold in St. Andrews, Stony Plain, with a median sold price of $405K. Sale prices have ranged from $153K to $529K. The typical home sells in 28 days, showing a balanced market. Homes are selling at 99.0% of their list price — very close to asking price. The most common property types sold include Detached Single Family (31), Condo (RAE) (11).
Recently Sold in St. Andrews
2 homes sold in the last 30 days. Showing 2 of 2 • Updated April 10, 2026 at 9:50 PM
View all 42 on the map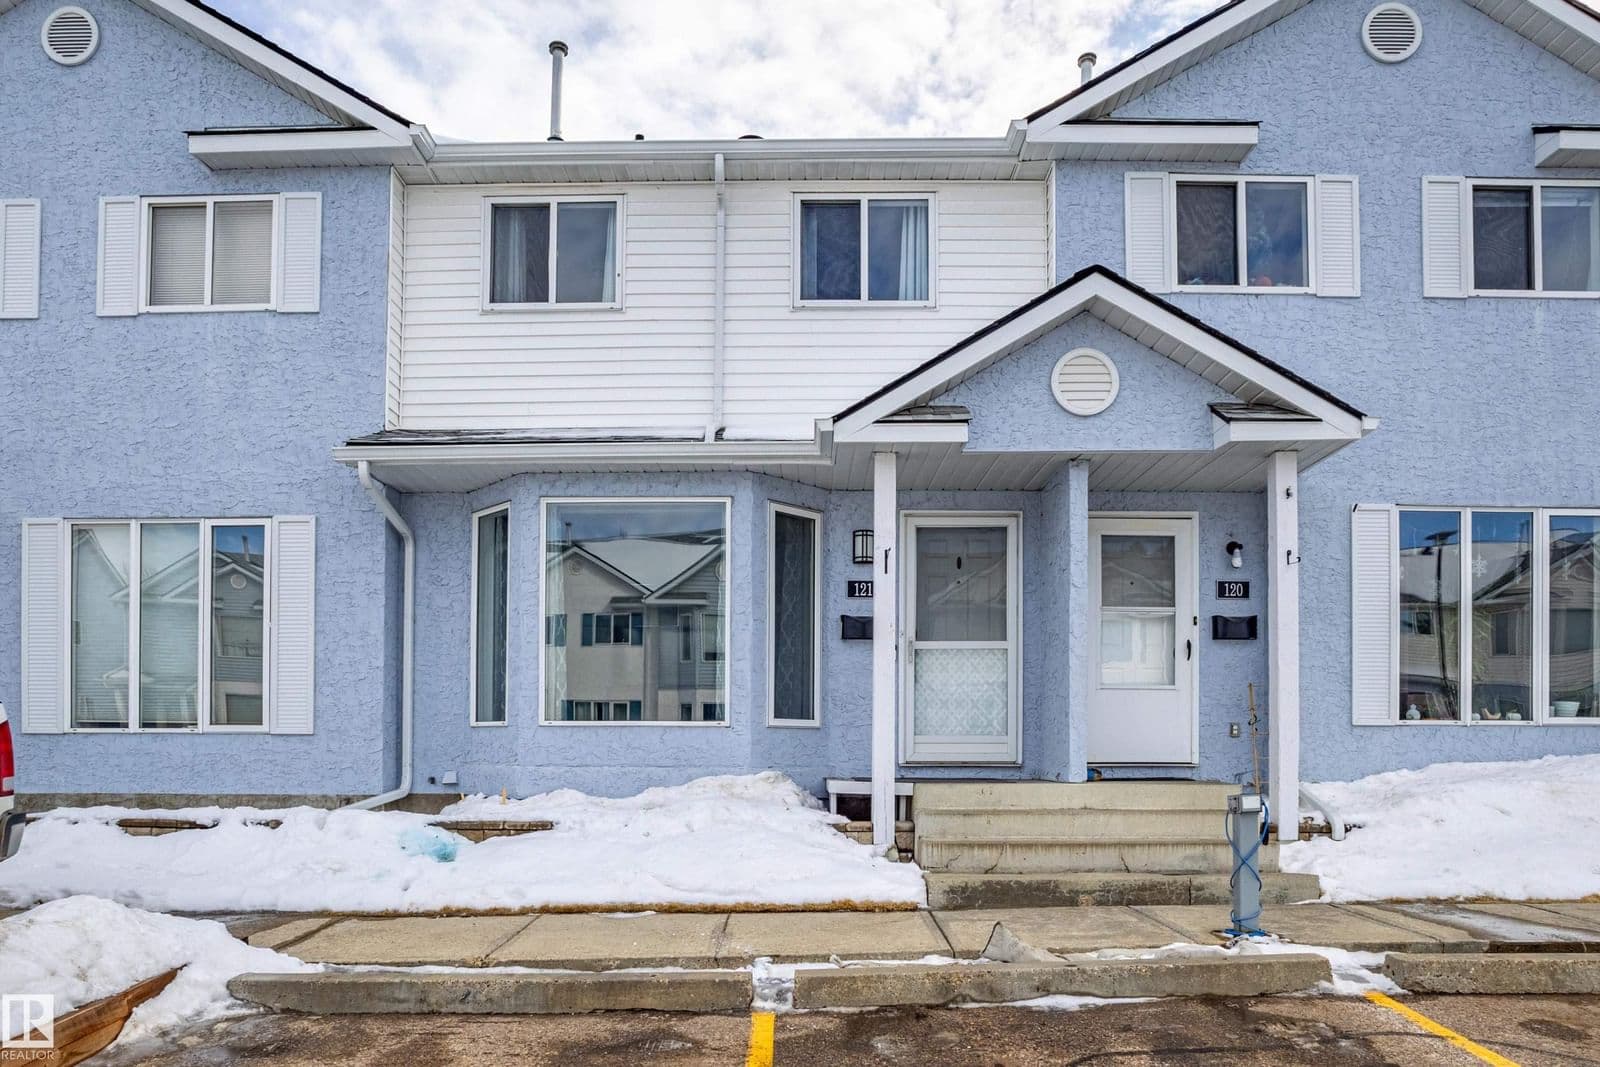
Create a free account to unlock the sold price, address, and sold date.
Unlock to see full address
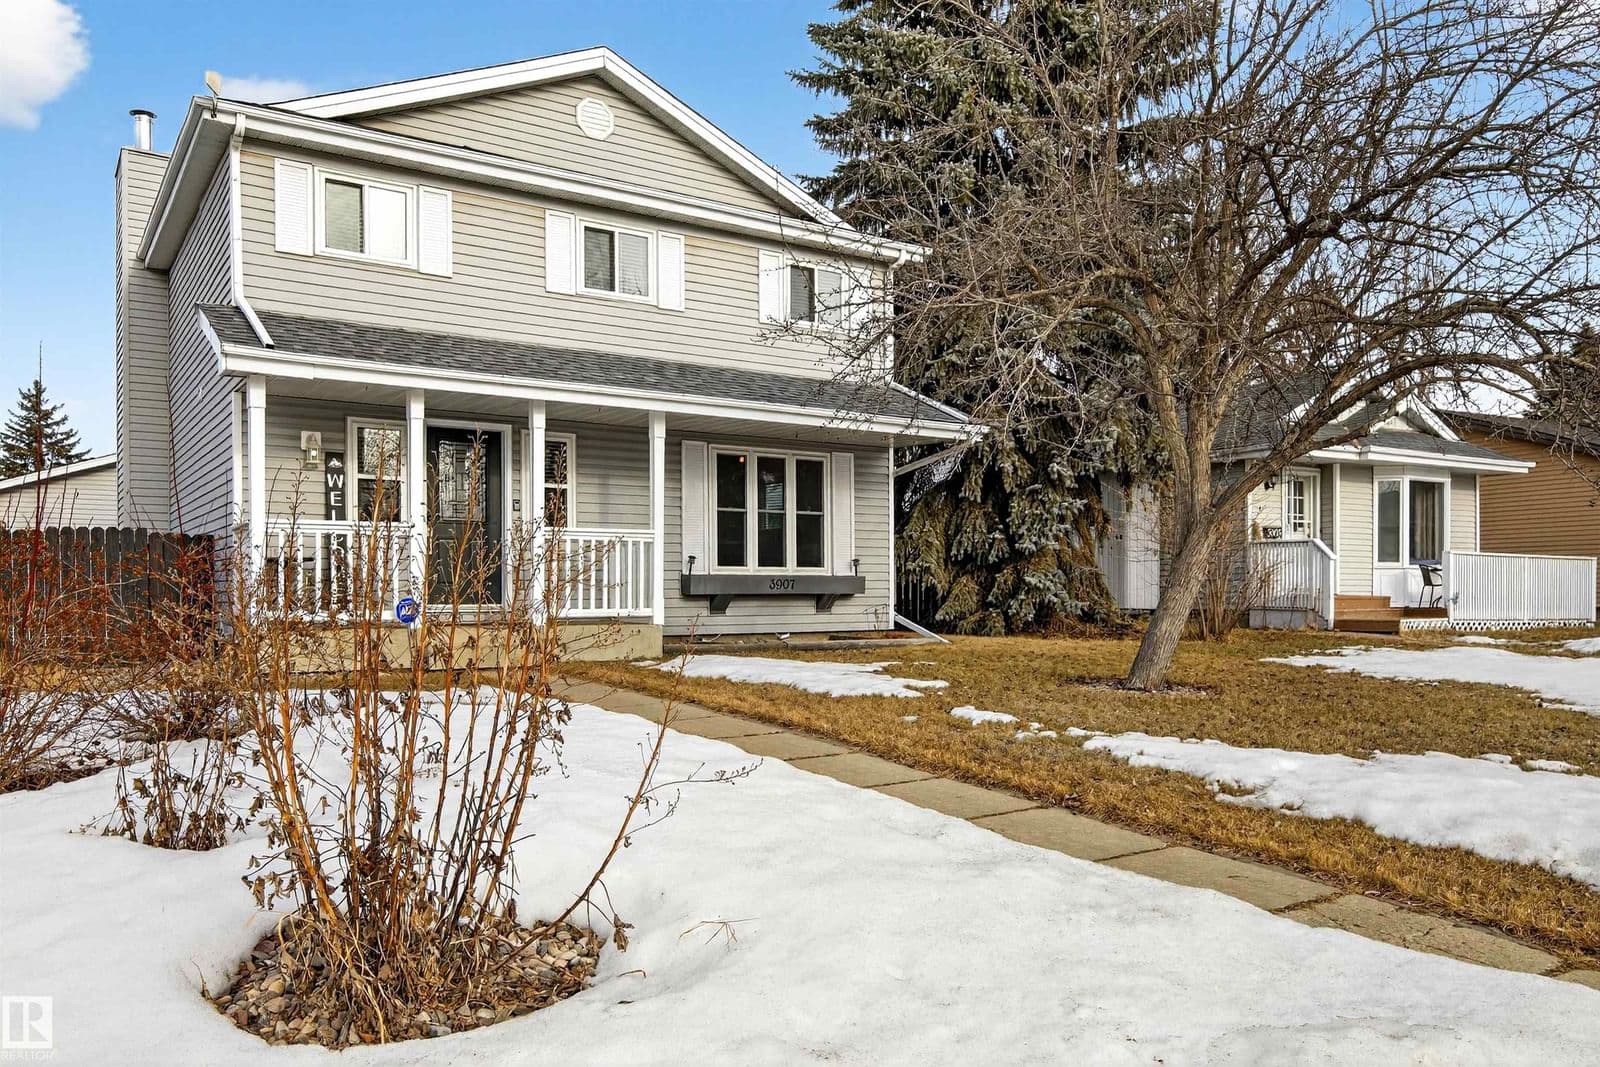
Create a free account to unlock the sold price, address, and sold date.
Unlock to see full address
Sold Data & Market Statistics for St. Andrews
See how the market is performing — prices, how fast homes are selling, and whether buyers or sellers have the advantage.
$405,050
Avg: $367,308
Range: $153,000 – $528,900
99.0%
Homes selling near asking
40 days
$296
42 homes sold
Click a property type to view its trends in the chart below:
All Property Types
(click to filter chart)2-Year Market Trends: All Property Types
(21 months)Negotiation & Cost Insights
Sold Above Asking
31%
60% sold below
Home Size Range
915 – 2,058
sq ft
Price Spread
±$103,150
standard deviation
42
Homes sold (last 2 years)
8
Currently for sale
4.0
Months of Inventory (MOI)
25.0%
Absorption Rate (30d)
2
New in April 2026
2 vs 2
Sold count (last 30 vs prior 30): 0.0%
Median price: $347,500 vs $322,250 (+7.8%)
How does St. Andrews compare to Stony Plain?
St. Andrews typical sale price
$347,500
2 sold in last 30 days
Stony Plain typical sale price
$443,500
39 sold in last 30 days
More neighbourhoods in Stony Plain
Browse recently sold homes by neighbourhood.
Frequently Asked Questions
Website provided by Kelly Grant
Data is deemed reliable but is not guaranteed accurate by the REALTORS® Association of Edmonton.
Copyright 2026 by the REALTORS® Association of Edmonton. All Rights Reserved.
The MLS® System Data is made available from the REALTORS® Association of Edmonton.
Days on hômm and market statistics values are calculated by hômm based on values provided in the REALTORS® Association of Edmonton listing data feed.
Mortgage values are calculated by hômm and are provided for estimate purposes only.
The hômm Estimate is calculated by instantestimate.house and is provided as a general estimate only.
Trademarks are owned or controlled by the Canadian Real Estate Association (CREA) and identify real estate professionals who are members of CREA (REALTOR®, REALTORS®) and/or the quality of services they provide (MLS®, Multiple Listing Service®).
*Sold date and price are as reported on the RAE's MLS® system.
Listing information last updated on April 11, 2026 at 10:00 pm (America/Edmonton)
Sign up to see what homes actually sold for
Create a free account to see final sale prices, days on market, and price history for recently sold homes in St. Andrews.
- See final sold prices, not just asking prices
- Compare your home to recent sales nearby
- Track market trends in your neighbourhood